


November’s lobbying landscape in Ottawa
The Cattle Feeders' Association, Toyota Canada, Ronald Mcdonald House, K'awat'si Economic Development, Portage Energy, and the Defense Metals Corp
Every month, this edition of Queen Street Analytics discusses noteworthy patterns in federal lobbying activity in Ottawa.
Table of Content:
The big picture view
Unusually active sectors and organizations in November
Organizations that registered to lobby federally in Canada for the first time in November
Highlights:
November’s lobbying activity was somewhat subdued relative to recent historical average
18 sectors stood out as unusually busy in terms of lobbying activity in November, including Indigenous stakeholder groups and crop producers
There were 36 organizations with unusually active lobbying activity in November, including the Cattle Feeders' Association, the Canola Growers and K'awat'si Economic Development
58 organizations registered to lobby federally in Canada for the first time this November, including, Portage Energy and Defense Metals Corp.
Queen Street Analytics provides a high-level overview of federal lobbying developments. If your organization has more specific needs, e.g.:
a full view of GR activity including lobby-communications, submitted briefs, witness appearances and regulatory commenting
creating custom-dashboards to track GR activity on specific issues
accessing dedicated breakdowns of GR activity by sector, organization, or subject
creating stakeholder presentations to compare your organization’s GR activity to a selected set of peers
historical snapshots to analyze trends,
consider subscribing to LobbyIQ’s GR-tracking package.
For a comparison to last month’s lobbying landscape issue, see here:

1. The 30,00 Foot View
With under 3,700 filings, this November was more quiet than the recent historical average in terms of overall lobbying activity, as can be readily seen in Exhibit 1, a snapshot of LobbyIQ’s big-picture dashboard.

2. Unusual Lobbying Activity
What industries were the main source of communications activity in November? A simple prediction model on the number of filings at the sector-level generates the deviations from trend depicted in Exhibit 2, where “Excess Comms”, are actual minus predicted filings, rank-ordered left-to-right across 145 sectors.

Which industries were outliers in November?
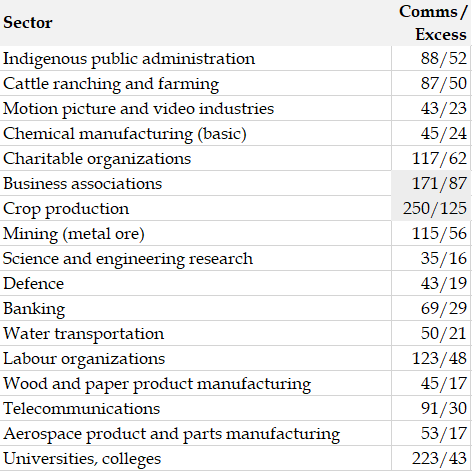
In Exhibit 2 there are many sectors with “Excess Comms > 15” (on the left). Exhibit 3 breaks these out, sorting the sectors by the deviation of their November activity relative to their baseline amount of lobbying activity (Excess/Comms).
The biggest lobbying outlier in relative terms was Indigenous stakeholder groups. The biggest lobbying outlier in absolute terms was the Crop production sector, with 125 excess communications.
In contrast, E-NGOs were the biggest negative outlier in November (on the far right of Exhibit 2), with 46 lobby communications less than predicted by our model.
Outlier activity in Exhibit 3 can be traced to one of three stories:
targeted lobby campaigns by single player in an industry
targeted lobby campaigns where a set of players in an industry lobby at the same time
annual lobby days, when an entire industry descends on Ottawa
For the crop production sector for example, it is the third story, because agricultural trade associations typically choose the fall for their lobby days, as Exhibit 4 shows.

Because annual lobby days are not particularly indicative of any underlying patterns in GR activity, we want to distinguish lobbying in Exhibit 3 that is not driven by them. A simple proxy is to look for instances where individual organizations drive the industry outliers in Exhibit 3.
Organizations that displayed unusual lobbying activity in November
A simple prediction model on the number of filings at the organization-month-level identifies which organizations were unusually active in November, relative to their own past lobbying activity. The top half of Exhibit 5 lists the organizations with “excess comms” that belong to the outlier-sectors listed in Exhibit 3. In its bottom half (starting with Broadcast media), Exhibit 5 lists additional organizations that exhibited excess lobby communications in November, but where the sector overall didn’t stand out in Exhibits 2 and 3.

3. New Organizations Entering the GR Landscape
On average, there are around 5,500 to 6,000 open federal lobby-registrations at any moment in time, representing around 2,500 unique organizations, with a mix of in-House registrations and registrations through external consultants. Every month, some organizations churn and some new organizations enter the frame of federal lobbying.
Exhibit 6 below lists the 58 organizations that registered to lobby federally in Canada for the first time in November 2024, including their external representation (if they chose to have any).

This concludes today’s issue of Queen Street Analytics.