


October’s lobbying landscape in Ottawa
Edgeworthbox Inc, Habitat For Humanity, the Canadian Medical and Dental Associations, the Saskatchewan Association of Rural Municipalities, Agnico Eagle Mines, the National Police Federation, Amazon

Keeping a close eye on today’s federal lobbying is the canary in the coalmine that lets us anticipate tomorrow’s legislative and regulatory changes. That is why, every month, Queen Street Analytics provides key updates on noteworthy patterns in federal lobbying activity in Ottawa.
Table of Content:
The big picture view
Unusually active sectors and organizations in October
Organizations that registered to lobby federally in Canada for the first time in October
Highlights:
October’s lobbying activity was in line with the recent historical average, with just under 4,300 communications filed
28 sectors stood out as unusually busy in terms of lobbying activity in October, including the Software sector, Medical associations, Tourism associations, and Indigenous stakeholder groups (with a financial bend)
There were 54 organizations with unusually active lobbying activity in October, including Edgeworthbox Inc, Habitat For Humanity, the Canadian Medical and Dental Associations, the Saskatchewan Association of Rural Municipalities, Agnico Eagle Mines, the National Police Federation, and Amazon
63 organizations registered to lobby federally in Canada for the first time this October, including, i.a., the Sikh Federation of Canada
Queen Street Analytics provides a high-level overview of federal lobbying developments. If your organization has more specific needs, e.g.:
a full view of GR activity including lobby-communications, submitted briefs, witness appearances and regulatory commenting
creating custom-dashboards to track GR activity on specific issues
accessing dedicated breakdowns of GR activity by sector, organization, or subject
receiving daily email updates on GR developments in your key issues by industry, as well as weekly email updates on GR developments by industry, and weekly GR insider reports on changes in the GR landscape, including new relationships, changes in GR-teams, and new organizations entering the GR landscape
creating stakeholder presentations to compare your organization’s GR activity to a selected set of peers
historical snapshots to analyze trends,
consider subscribing to LobbyIQ’s GR-tracking package.
For a comparison to last month’s lobbying landscape issue, see here:

1. The 30,00 Foot View
With just under 4,300 filings, this October was very much in line with the recent historical average in terms of overall lobbying activity, as can be readily seen in Exhibit 1, taken from LobbyIQ’s open-access dashboard.

2. Unusual Lobbying Activity
What industries were the main source of communications activity in October? A simple prediction model on the number of filings at the sector-level generates the deviations from trend depicted in Exhibit 2, where “Excess Comms”, are actual minus predicted filings, rank-ordered left-to-right across 145 sectors.
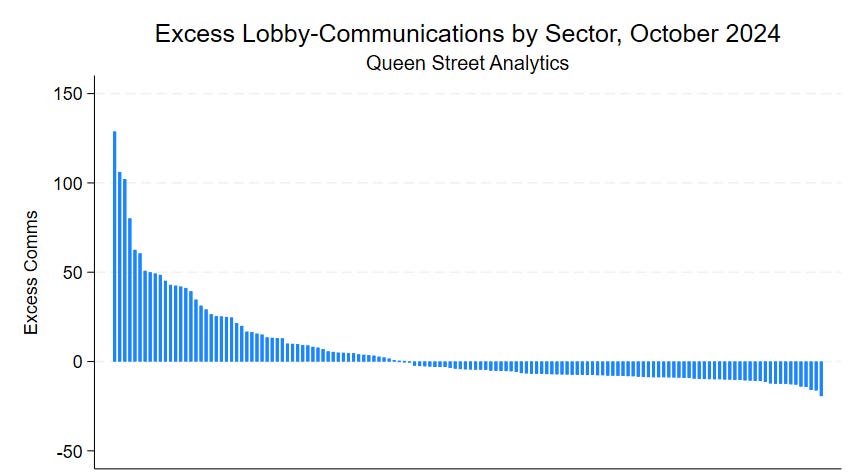
Which industries were outliers in October?
In Exhibit 2 there are 28 sectors with “Excess Comms > 15” (on the left). Exhibit 3 breaks these out, sorting the sectors by the deviation of their October activity relative to their baseline amount of lobbying activity (Excess/Comms). For example, E-NGOs are the sector furthest to the left in Exhibit 2, with 128 excess communications, but ranked 13th in Exhibit 3 because of 128 is weighted relative to E-NGOs high baseline lobby communications activity.

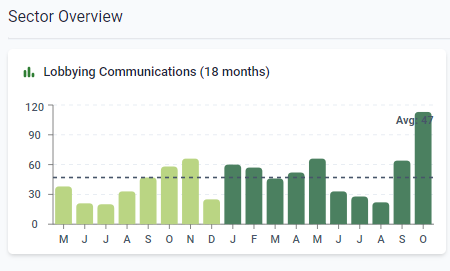
The software sector dominates Exhibit 3, and Exhibit 4 from LobbyIQ’s software sector dashboard shows this elevated lobbying activity visually.
Outlier activity in Exhibit 3 can usually be traced back to one of three stories:
targeted lobby campaigns by single player in an industry
targeted lobby campaigns where a set of players in an industry lobby at the same time
annual lobby days, when an entire industry descends on Ottawa
For the software sector in October, it appears to be the first story, with a big spike in lobbying by EdgeworthBox Canada, Inc, as can be seen on Exhibit 5

A simple, though not fail-safe, proxy for distinguishing the three types of lobby-activity spikes is to look for individual organization outliers within sectors and see if and where they drive the industry outliers in Exhibit 3.
To check on that, the following provides an overview of all organizations with elevated lobbying in October, across all sectors.
Organizations that displayed unusual lobbying activity in October
A simple prediction model on the number of filings at the organization-month-level identifies which organizations were unusually active in October, relative to their own past lobbying activity. The top half of Exhibit 6 lists the organizations with “excess comms” that belong to the outlier-sectors listed in Exhibit 3.
Below that, the exhibit lists additional organizations that also exhibited excess lobby communications in October, but where the sector overall didn’t stand out in Exhibits 2 and 3. The second column again lists the number of filed communications relative to their excess over predicted (Comms / Excess).
3. New Organizations Entering the GR Landscape
On average, there are between 5,500 and 6,000 open federal lobby-registrations at any moment in time, representing around 2,500 unique organizations, with a mix of in-House registrations and registrations through external consultants. Every month, some organizations churn and some new organizations enter the frame of federal lobbying.
Exhibit 7 below lists the 63 organizations that registered to lobby federally in Canada for the first time in this October 2024, including their external representation if they chose to have any.

This concludes today’s issue of Queen Street Analytics.