This week’s issue focuses on the sectors and organizations that stood out in their communications and registrations activity in October.1
The CliffsNotes:
October saw almost 3,900 lobby-communication filings, around 20% more than predicted by long-run lobby-communications patterns.
Environmental NGOs (Environmental Defense Fund, David Suzuki, Nature United, the International Boreal Conservation Campaign, Carbon Removal Canada, and Deep Sky Corp), Crop Producers, Indigenous organizations (Metis Settlements Council, Katzie Kwantlen Semiahmoo Nations, Huu-Ay-Aht, Lake Babine, and the Metis National Council), and Banks (Scotia, TD, RBC, BMO and the umbrella organization CBA) were among the sectors were higher lobbying was pervasive across many organizations, implying that the elevated lobbying activity is likely explained by a specific policy-issue affecting a sector as a whole
There were also instances of elevated lobbying activity that were specific to individual organizations including Xplore Inc (in Telecoms), HealthcareCan (in Healthcare), and Pathways Alliance (in Oil and gas)
For a comparison, check out last month’s newsletter#1 here:
1. Lobbying Communications in October 2023
Exhibit 1 shows that October saw almost 3,900 lobby-communication filings, around 20% more than predicted (excess column) when we extrapolate from a simple model of communications with linear time trends and calendar-month cyclical shifters.
2. Which Sectors Saw Unusual Lobbying Activity?
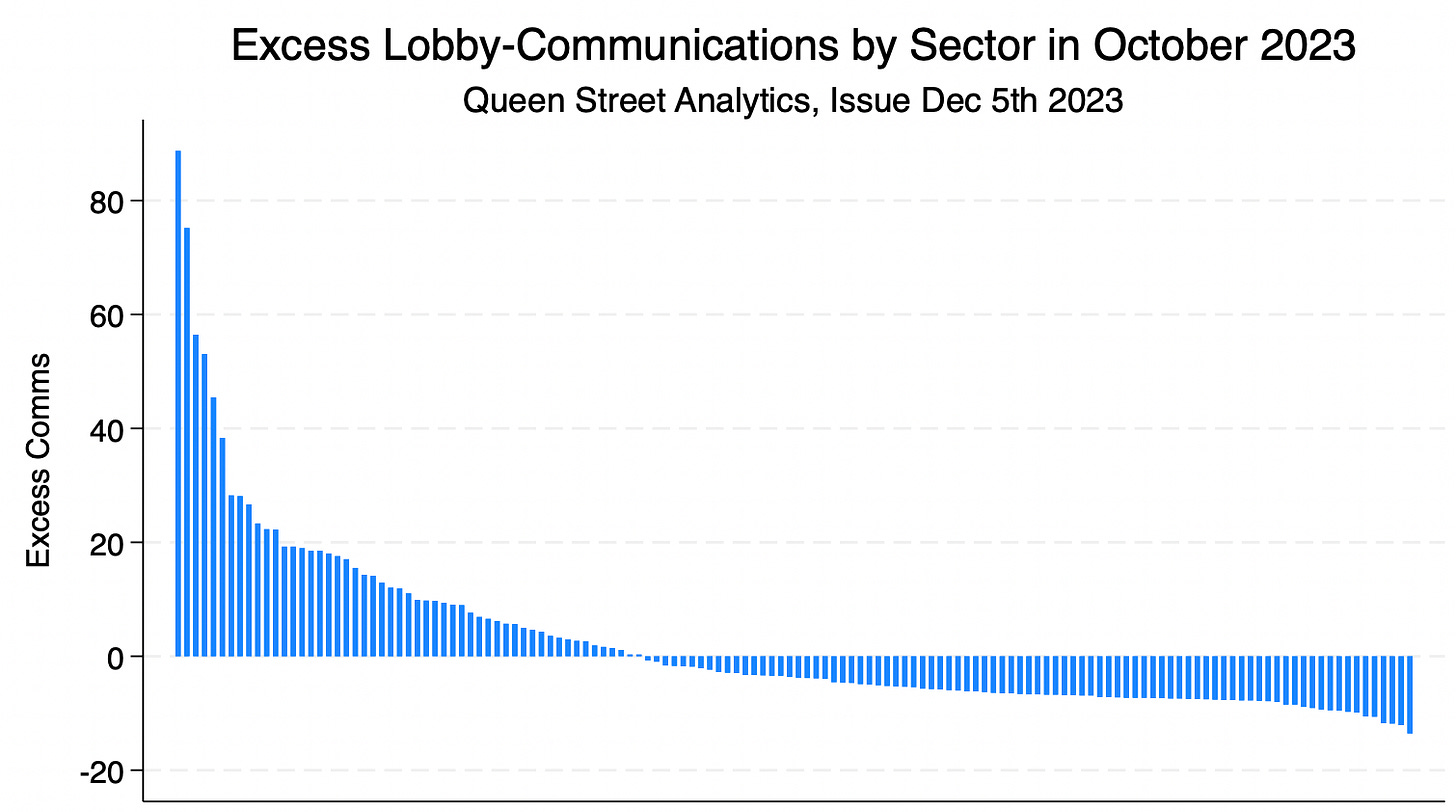
Behind the generally higher activity in October, there were several outlier sectors which saw unusually high lobbying activity. To identify these breakout sectors, we count filings by sector-month-pair, and run a prediction model with separate shifters for each sector (creating a panel of 148 sector-specific monthly time-series). Exhibit 2 charts the difference between the actual and predicted number of filings in October, rank-ordered left-to-right across the 148 sectors. The biggest positive breakout has 88 more communication filings than predicted (far left). Negative values on the right reflect sectors with unusually muted activity.
Exhibit 3 shows the 19 sectors with unexpectedly high lobbying-communications activity in excess of 18. Universities, Charitable organizations, E-NGOs, Telecoms and Labour organizations dominate this list in October, i.e. the same top-five we saw in the September rankings, albeit with a different rank-order.
Some of the sectors with breakout lobbying-patterns in Exhibit 3 are bound to be driven by focused communication campaigns of just one or two organizations in that sector, whereas others are driven by sector-wide elevated lobbying activity.
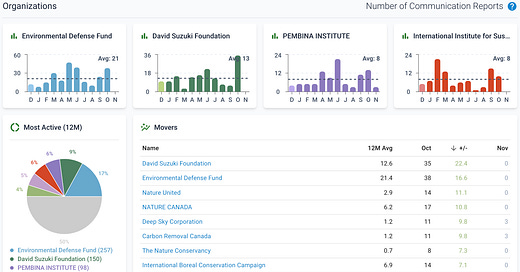
The quickest gauge for flagging breakout lobbying campaigns by organizations within a sector is provided on the organization clusters on LobbyIQ's sector-dashboards. Exhibit 4, for example, shows the organization-cluster on LobbyIQ’s E-NGO dashboard, where we can see that E-NGOs’ higher-than-usual lobbying activity in October was driven not by one, but six or seven E-NGOs with significantly elevated communications activity (see the +/- column in the Movers table of the exhibit, comparing October to the previous 12-month average).
3. Organizations’ Communications Campaigns
To provide a systematic view of whether elevated sector-level activity is driven by many firms or by the focused lobbying campaigns of just a few individual organizations, we fan out the communications-data into a panel of several thousand organization-specific monthly time-series, and look for October’s breakouts from the predicted number of communications at the organization-level.
Exhibit 5a+5b list fifty-nine organizations that had 10+ excess monthly communication-filing (i.e. 10+ more than predicted by their usual communications patterns). The first two columns list the number of filings, and the deviation from predicted.
We cluster the organizations by sector, and sort by sectors’ number of organizations with breakout activity. Sectors at the top have more such organizations in October and their elevated activity is therefore more likely driven by industry-wide concerns. This is quite obvious in Exhibit 5a:
At the top, we see a long list of E-NGO’s (EDF, David Suzuki, Nature United, the International Boreal Conservation Campaign, Carbon Removal Canada, and Deep Sky Corp), likely related to the upcoming COP28 UAE - United Nations Climate Change Conference.
The higher activity by crop producers is mostly related to Bill C-234 before the Senate, and COP28 May have played a role in some of those conversations as well, given the increasing focus on the connection of carbon to food production.
We are not aware of anything systematic connecting the unusually high communications activity among Indigenous organizations (Metis Settlements Council, Katzie Kwantlen Semiahmoo Nations, Huu-Ay-Aht, Lake Babine, and the Metis National Council), but the higher activity by banks (Scotia, TD, RBC, BMO and the umbrella organization CBA) is likely connected to financial processing transaction fees coming under increasing scrutiny from consumer advocacy groups.
The NCCM’s and the Center for Israel and Jewish Affairs’ elevated communication activity are both obviously explained by recent events in Israel and Gaza.
In contrast, as we go down Exhibit 5b, we see more instances where excess lobbying is more likely to be driven by idiosyncratic organization-level concerns.
3. Registrations
There were also a number of organizations with unusually high numbers of registrations since October.
The number of new registrations needs to be taken with a grain of salt because a higher number of registrations can reflect an intent to lobby more intensely (hence requiring more registered lobbyists), but could also reflect different lobby-firms’ varying habits in how many consultants to assign to a client (with some firms preferring several consultants assigned to a client, and some firms assigning one consultant per client by default). With that caveat, Exhibit 6 nevertheless shows a ranking of the organization with the highest number of new registrations since the beginning of October (NewReg column), broken out into registrations with external consultants (the majority) vs in-House registrations.
This concludes today’s newsletter. Next week, we take a close look at which government institutions and DPOHs saw unusual lobbying communications activity in October.
Lobbying communication filings need to be reported to the government by the 15th of the next month. Civil servants then take a few days to enter those filings into the public record. By the end of a month, the previous month’s filings are approximately complete. Given this cadence, Queen Street Analytics’ first 2 newsletters in November consider the “last month” to be September, and the 3rd and 4th newsletter switch to considering “last month” to be October. Restated, the data landscape for GR activity in September is analyzed in October’s newsletters #3 and #4 plus November’s newsletters #1-#2.


