


September’s lobbying landscape in Ottawa
Arcelormittal Dofasco GP, Wiikwemkoong Unceded Territory, Air Products Canada Ltd, Edgeworthbox Canada, Innovative Medicines Canada, the Wood Pallet and Container Association, Manulife, and Copibec

Keeping a close eye on today’s federal lobbying is the canary in the coalmine that lets us anticipate tomorrow’s legislative and regulatory changes. That is why, every month, Queen Street Analytics provides key updates on noteworthy patterns in federal lobbying activity in Ottawa.
Table of Content:
The big picture view
Unusually active sectors and organizations in September
Organizations that registered to lobby federally in Canada for the first time in September
Highlights:
September’s lobbying activity was in line with the recent historical average, with around 2,700 communications filed
15 sectors stood out as unusually busy in terms of lobbying activity in September, including Performing and visual arts, Metal, Chemical and Pharmaceutical manufacturing, Banking
There were 38 organizations with unusually active lobbying activity in September, including Arcelormittal Dofasco GP, Wiikwemkoong Unceded Territory, Air Products Canada Ltd, Edgeworthbox Canada, Innovative Medicines Canada, the Wood Pallet And Container Association, Manulife, Copibec, and the Western Canadian Shippers' Coalition
47 organizations registered to lobby federally in Canada for the first time this September.
Queen Street Analytics provides a high-level overview of federal lobbying developments. If your organization has more specific needs, e.g.:
a full view of GR activity including lobby-communications, submitted briefs, witness appearances and regulatory commenting
creating custom-dashboards to track GR activity on specific issues
accessing dedicated breakdowns of GR activity by sector, organization, or subject
receiving daily email updates on GR developments in your key issues by industry, as well as weekly email updates on GR developments by industry, and weekly GR insider reports on changes in the GR landscape, including new relationships, changes in GR-teams, and new organizations entering the GR landscape
creating stakeholder presentations to compare your organization’s GR activity to a selected set of peers
historical snapshots to analyze trends,
consider subscribing to LobbyIQ’s GR-tracking package.
For a comparison to last month’s issue on the lobbying landscape, see here:

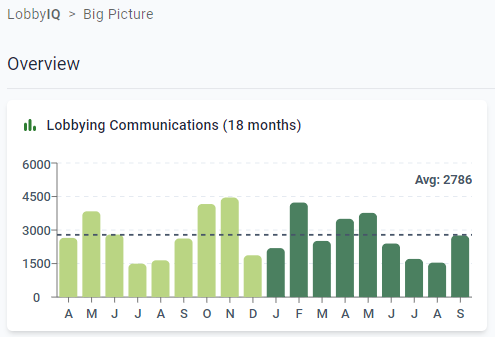
1. The 30,00 Foot View
With right around 2,700 filing, this September was very much in line with the recent historical average in terms of overall lobbying activity, as can be radily seen in Exhibit 1.
2. Unusual Lobbying Activity
What industries were the main source of communications activity in September? A simple prediction model on the number of filings at the sector-level generates the deviations from trend depicted in Exhibit 2, where “Excess Comms”, are actual minus predicted filings, rank-ordered left-to-right across 145 sectors.
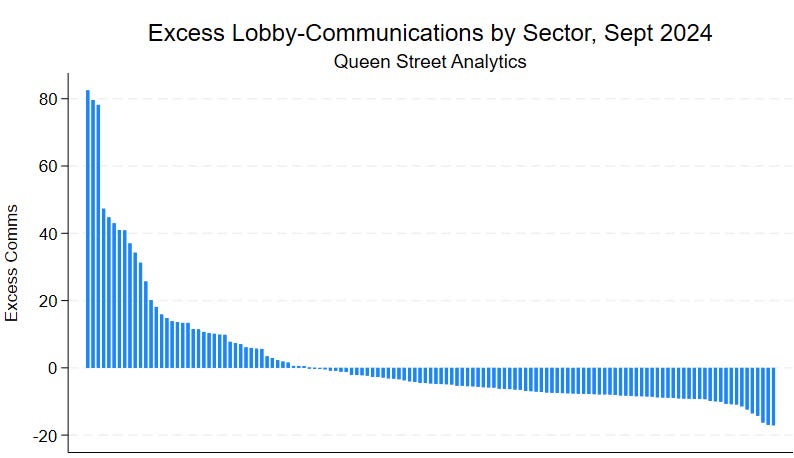
Which industries were outliers in September?
Exhibit 2 displays 15 sectors with “Excess Comms > 15” (on the left). Exhibit 3 breaks these out, sorted by their deviation relative to each sector’s baseline lobbying activity (Excess/Comms). (For example, universities are the sector furthest to the left in Exhibit 2, with 82 excess communications, but ranked 11th in Exhibit 3 because of high baseline lobby communications activity).

Metals manufacturing is in the top-three of Exhibit 3 for the second month running, as can also be seen in Exhibit 4 from LobbyIQ’s metals manufacturing sector dashboard.

Outlier activity in Exhibit 3 can usually be traced back to one of three stories:
targeted lobby campaigns by single player in an industry
targeted lobby campaigns where a set of players in an industry lobby at the same time
annual lobby days, when an entire industry descends on Ottawa
Lobby days usually generate big spikes in lobby filings that are about 12 months apart. For example, Exhibit 5 shows the 18-month lobbying timeline for the banking sector, which may well have been driven by an industry lobby day.

A simple (though not fail-safe) way of distinguishing the three types of lobby-activity spikes is to look for individual organization outliers within sectors and see if and where they drive the industry outliers in Exhibit 3.
To check on that, the following provides an overview of all organizations with elevated lobbying in September, across all sectors.
Which particular organizations displayed unusual lobbying activity in September?
A simple prediction model on the number of filings at the organization-month-level identifies which organizations were unusually active in September, relative to their own past lobbying activity. The top half of Exhibit 6 list the organizations with “excess comms” that belong to the outlier-sectors listed in Exhibit 3. Below that, the exhibit lists additional organizations that also displayed excess communications, but where the sector overall didn’t stand out. The second column again lists the number of filed communications relative to their excess over predicted (Comms / Excess).

3. New Organizations Entering the GR Landscape
On average, there are between 5,500 and 6,000 open federal lobby-registrations at any moment in time, representing around 2,500 unique organizations, with a mix of in-House registrations and registrations through external consultants. Every month, some organizations churn and some new organizations enter the frame of federal lobbying.
Exhibit 7 below lists the 47 organizations that registered to lobby federally in Canada for the first time in this September 2024, including their external representation if they chose to have any.

This concludes today’s issue of Queen Street Analytics.